Debugging
- decoding an oops/panic
- list debugging
- memory debugging
- locking debugging
- profiling
static noinline void do_oops(void)
{
    *(int*)0x42 = 'a';
}

static int so2_oops_init(void)
{
    pr_info("oops_init\n");
    do_oops();

    return 0;
}

static void so2_oops_exit(void)
{
    pr_info("oops exit\n");
}

module_init(so2_oops_init);
module_exit(so2_oops_exit);
root@qemux86:~/skels/debugging/oops# insmod oops.ko
BUG: unable to handle kernel NULL pointer dereference at 00000042
IP: do_oops+0x8/0x10 [oops]
*pde = 00000000
Oops: 0002 [#1] SMP
Modules linked in: oops(O+)
CPU: 0 PID: 234 Comm: insmod Tainted: G           O     4.15.0+ #3
Hardware name: QEMU Standard PC (i440FX + PIIX, 1996), BIOS Ubuntu-1.8.2-1ubuntu1 04/01/2014
EIP: do_oops+0x8/0x10 [oops]
CR0: 80050033 CR2: 00000042 CR3: 0785f000 CR4: 00000690
EIP: 0x44902cc2
EFLAGS: 00000206 CPU: 0
EAX: ffffffda EBX: 08afb050 ECX: 0000eef4 EDX: 08afb008
ESI: 00000000 EDI: bf914dbc EBP: 00000000 ESP: bf914c1c
DS: 007b ES: 007b FS: 0000 GS: 0033 SS: 007b
Code: <a3> 42 00 00 00 5d c3 90 55 89 e5 83 ec 04 c7 04 24 24 70 81 c8 e8
Killed
root@qemux86:~/skels/debugging/oops# insmod oops.ko
BUG: unable to handle kernel NULL pointer dereference at 00000042
Call Trace:
so2_oops_init+0x17/0x20 [oops]
do_one_initcall+0x37/0x170
? cache_alloc_debugcheck_after.isra.19+0x15f/0x2f0
? __might_sleep+0x32/0x90
? trace_hardirqs_on_caller+0x11c/0x1a0
? do_init_module+0x17/0x1c2
? kmem_cache_alloc+0xa4/0x1e0
? do_init_module+0x17/0x1c2
do_init_module+0x46/0x1c2
load_module+0x1f45/0x2380
SyS_init_module+0xe5/0x100
do_int80_syscall_32+0x61/0x190
entry_INT80_32+0x2f/0x2f
Killed
$ addr2line -e oops.o  0x08
$ skels/debugging/oops/oops.c:5
$ # 0x08 is the offset of the offending instruction inside the oops.ko module
$ cat /proc/modules
oops 20480 1 - Loading 0xc8816000 (O+)

$ objdump -dS --adjust-vma=0xc8816000 oops.ko
c8816000:       b8 61 00 00 00          mov    $0x61,%eax

static noinline void do_oops(void)
{
c8816005:       55                      push   %ebp
c8816006:       89 e5                   mov    %esp,%ebp
*(int*)0x42 = 'a';
c8816008:       a3 42 00 00 00          mov    %eax,0x42
$ gdb ./vmlinux

(gdb) list *(do_panic+0x8)
0xc1244138 is in do_panic (lib/test_panic.c:8).
3
4 static struct timer_list panic_timer;
5
6 static void do_panic(struct timer_list *unused)
7 {
8         *(int*)0x42 = 'a';
9 }
10
11        static int so2_panic_init(void)
static struct timer_list panic_timer;

static void do_panic(struct timer_list *unused)
{
    *(int*)0x42 = 'a';
}

static int so2_panic_init(void)
{
    pr_info("panic_init\n");

    timer_setup(&panic_timer,  do_panic, 0);
    mod_timer(&panic_timer, jiffies + 2 * HZ);

    return 0;
}
static inline void list_del(struct list_head *entry)
{
        __list_del(entry->prev, entry->next);
        entry->next = (struct list_head*)LIST_POISON1;
        entry->prev = (struct list_head*)LIST_POISON2;
}

BUG: unable to handle kernel NULL pointer dereference at 00000100
IP: crush+0x80/0xb0 [list]
BUG: unable to handle kernel paging request at 5a5a5a5a
IP: [<c1225063>] __list_del_entry+0x37/0x71
…
Call Trace:
[<c12250a8>] list_del+0xb/0x1b
[<f1de81a2>] use_before_init+0x31/0x38 [crusher]
[<f1de8265>] crush_it+0x38/0xa9 [crusher]
[<f1de82de>] init_module+0x8/0xa [crusher]
[<c1001072>] do_one_initcall+0x72/0x119
[<f1de82d6>] ? crush_it+0xa9/0xa9 [crusher]
[<c106b8ae>] sys_init_module+0xc8d/0xe77
[<c14d7d18>] syscall_call+0x7/0xb
noinline void use_before_init(void)
{
     struct list_m *m = kmalloc(sizeof(*m), GFP_KERNEL);

     printk("%s\n", __func__);
     list_del(&m->lh);
}
BUG: unable to handle kernel paging request at 6b6b6b6b
IP: [<c1225063>] __list_del_entry+0x37/0x71
…
Call Trace:
[<c12250a8>] list_del+0xb/0x1b
[<f4c6816a>] use_after_free+0x38/0x3f [crusher]
[<f4c6827f>] crush_it+0x52/0xa9 [crusher]
[<f4c682de>] init_module+0x8/0xa [crusher]
[<c1001072>] do_one_initcall+0x72/0x119
[<f4c682d6>] ? crush_it+0xa9/0xa9 [crusher]
[<c106b8ae>] sys_init_module+0xc8d/0xe77
[<c14d7d18>] syscall_call+0x7/0xb
noinline void use_after_free(void)
{
    struct list_m *m = kmalloc(sizeof(*m), GFP_KERNEL);

    printk("%s\n", __func__);
    kfree(m);
    list_del(&m->lh);
}
# insmod /system/lib/modules/crusher.ko test=use_before_init
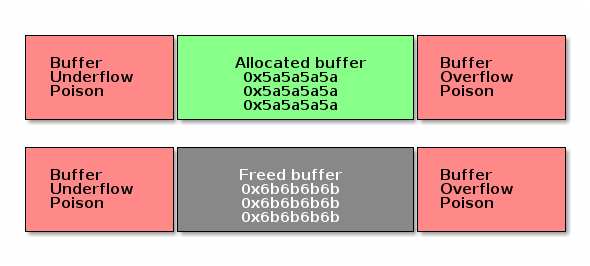
Slab corruption: size-4096 start=ed612000, len=4096
000: 00 00 00 00 00 00 00 00 00 00 00 00 00 00 00 00
010: 00 00 00 00 00 00 00 00 00 00 00 00 00 00 6b 6b
noinline void use_after_free2(void)
{
    char *b = kmalloc(3000, GFP_KERNEL);
    kfree(b);
    memset(b, 0, 30);
    b = kmalloc(3000, GFP_KERNEL);
    kfree(b);
}
slab error in verify_redzone_free(): cache `dummy': memory outside object was overwritten
Pid: 1282, comm: insmod Not tainted 3.0.16-mid10-00007-ga4a6b62-dirty #70
Call Trace:
[<c10cc1de>] __slab_error+0x17/0x1c
[<c10cc7ca>] __cache_free+0x12c/0x317
[<c10ccaba>] kmem_cache_free+0x2b/0xaf
[<f27f1138>] buffer_overflow+0x4c/0x57 [crusher]
[<f27f12aa>] crush_it+0x6c/0xa9 [crusher]
[<f27f12ef>] init_module+0x8/0xd [crusher]
[<c1001072>] do_one_initcall+0x72/0x119
[<c106b8ae>] sys_init_module+0xc8d/0xe77
[<c14d7d18>] syscall_call+0x7/0xb
eb002bf8: redzone 1:0xd84156c5635688c0, redzone 2:0x0
noinline void buffer_overflow(void)
{
    struct kmem_cache *km = kmem_cache_create("dummy", 3000, 0, 0, NULL);
    char *b = kmem_cache_alloc(km, GFP_KERNEL);

    printk("%s\n", __func__);
    memset(b, 0, 3016);
    kmem_cache_free(km, b);
}
KASan is slower than DEBUG_PAGEALLOC, but KASan works on sub-page granularity level, so it able to find more bugs.
static int leak_init(void)
{
    pr_info("%s\n", __func__);

    (void)kmalloc(16, GFP_KERNEL);

    return 0;
}

MODULE_LICENSE("GPL v2");
module_init(leak_init);
root@qemux86:~# insmod skels/debugging/leak/leak.ko
leak: loading out-of-tree module taints kernel.
leak_init
root@qemux86:~# echo scan > /sys/kernel/debug/kmemleak
root@qemux86:~# echo scan > /sys/kernel/debug/kmemleak
kmemleak: 1 new suspected memory leaks (see /sys/kernel/debug/kmemleak)
root@qemux86:~# cat /sys/kernel/debug/kmemleak
unreferenced object 0xd7871500 (size 32):
comm "insmod", pid 237, jiffies 4294902108 (age 24.628s)
hex dump (first 32 bytes):
5a 5a 5a 5a 5a 5a 5a 5a 5a 5a 5a 5a 5a 5a 5a 5a  ZZZZZZZZZZZZZZZZ
5a 5a 5a 5a 5a 5a 5a 5a 5a 5a 5a 5a 5a 5a 5a a5  ZZZZZZZZZZZZZZZ.
backtrace:
[<(ptrval)>] kmem_cache_alloc_trace+0x163/0x310
[<(ptrval)>] leak_init+0x2f/0x1000 [leak]
[<(ptrval)>] do_one_initcall+0x57/0x2e0
[<(ptrval)>] do_init_module+0x4b/0x1be
[<(ptrval)>] load_module+0x201a/0x2590
[<(ptrval)>] sys_init_module+0xfd/0x120
[<(ptrval)>] do_int80_syscall_32+0x6a/0x1a0
static noinline int thread_a(void *unused)
{
  mutex_lock(&a); pr_info("%s acquired A\n", __func__);
  mutex_lock(&b); pr_info("%s acquired B\n", __func__);

  mutex_unlock(&b);
  mutex_unlock(&a);

  return 0;
}
static noinline int thread_b(void *unused)
{
  mutex_lock(&b); pr_info("%s acquired B\n", __func__);
  mutex_lock(&a); pr_info("%s acquired A\n", __func__);

  mutex_unlock(&a);
  mutex_unlock(&b);

  return 0;
}
thread_a acquired A
thread_a acquired B
thread_b acquired B

======================================================
WARNING: possible circular locking dependency detected
4.19.0+ #4 Tainted: G           O
------------------------------------------------------
thread_b/238 is trying to acquire lock:
(ptrval) (a){+.+.}, at: thread_b+0x48/0x90 [locking]

but task is already holding lock:
(ptrval) (b){+.+.}, at: thread_b+0x27/0x90 [locking]

which lock already depends on the new lock.
the existing dependency chain (in reverse order) is:

-> #1 (b){+.+.}:
      __mutex_lock+0x60/0x830
      mutex_lock_nested+0x20/0x30
      thread_a+0x48/0x90 [locking]
      kthread+0xeb/0x100
      ret_from_fork+0x2e/0x38

-> #0 (a){+.+.}:
      lock_acquire+0x93/0x190
      __mutex_lock+0x60/0x830
      mutex_lock_nested+0x20/0x30
      thread_b+0x48/0x90 [locking]
      kthread+0xeb/0x100
      ret_from_fork+0x2e/0x38
other info that might help us debug this:

Possible unsafe locking scenario:

CPU0                    CPU1
----                    ----
lock(b);
                        lock(a);
                        lock(b);
lock(a);

*** DEADLOCK ***
static DEFINE_SPINLOCK(lock);

static void timerfn(struct timer_list *unused)
{
  pr_info("%s acquiring lock\n", __func__);
  spin_lock(&lock);   pr_info("%s acquired lock\n", __func__);
  spin_unlock(&lock); pr_info("%s released lock\n", __func__);
}

static DEFINE_TIMER(timer, timerfn);

int init_module(void)
{
  mod_timer(&timer, jiffies);

  pr_info("%s acquiring lock\n", __func__);
  spin_lock(&lock);   pr_info("%s acquired lock\n", __func__);
  spin_unlock(&lock); pr_info("%s released lock\n", __func__);
  return 0;
}
init_module acquiring lock
init_module acquired lock
init_module released lock
timerfn acquiring lock

================================
WARNING: inconsistent lock state
4.19.0+ #4 Tainted: G           O
--------------------------------
inconsistent {SOFTIRQ-ON-W} -> {IN-SOFTIRQ-W} usage.
ksoftirqd/0/9 [HC0[0]:SC1[1]:HE1:SE0] takes:
(ptrval) (lock#4){+.?.}, at: timerfn+0x25/0x60 [locking2]
{SOFTIRQ-ON-W} state was registered at:
lock_acquire+0x93/0x190
_raw_spin_lock+0x39/0x50
init_module+0x35/0x70 [locking2]
do_one_initcall+0x57/0x2e0
do_init_module+0x4b/0x1be
load_module+0x201a/0x2590
sys_init_module+0xfd/0x120
do_int80_syscall_32+0x6a/0x1a0
restore_all+0x0/0x8d
Possible unsafe locking scenario:

       CPU0
       ----
       lock(lock#4);
       <Interrupt>
       lock(lock#4);

       *** DEADLOCK ***

1 lock held by ksoftirqd/0/9:
#0: (ptrval) (/home/tavi/src/linux/tools/labs/skels/./debugging/locking2/locking2.c:13){+.-.}, at: call_timer_f0
stack backtrace:
CPU: 0 PID: 9 Comm: ksoftirqd/0 Tainted: G           O      4.19.0+ #4
Hardware name: QEMU Standard PC (i440FX + PIIX, 1996), BIOS 1.10.2-1ubuntu1 04/01/2014
Call Trace:
dump_stack+0x66/0x96
print_usage_bug.part.26+0x1ee/0x200
mark_lock+0x5ea/0x640
__lock_acquire+0x4b4/0x17a0
lock_acquire+0x93/0x190
_raw_spin_lock+0x39/0x50
timerfn+0x25/0x60 [locking2]