Debugging
Lecture objectives:
One essential part of Linux kernel development is debugging. In user space we had the support of the kernel so we could easily stop processes and use gdb to inspect their behavior. In the kernel, in order to use gdb we need to use hypervisor like QEMU or JTAG based hardware interfaces which are not always available. The Linux kernel provides a set of tools and debug options useful for investigating abnormal behavior.
In this lecture we will learn about:
- decoding an oops/panic
- list debugging
- memory debugging
- locking debugging
- profiling
Decoding an oops/panic
An oops is an inconsistent state that the kernel detects inside itself. Upon detecting an oops the Linux kernel kills the offending process, prints information that can help debug the problem and continues execution but with limited reliability.
Lets consider the following Linux kernel module:
static noinline void do_oops(void)
{
    *(int*)0x42 = 'a';
}

static int so2_oops_init(void)
{
    pr_info("oops_init\n");
    do_oops();

    return 0;
}

static void so2_oops_exit(void)
{
    pr_info("oops exit\n");
}

module_init(so2_oops_init);
module_exit(so2_oops_exit);
Notice that ‘’do_oops’’ function tries to write at an invalid memory address. Because the kernel cannot find a suitable physical page were to write, it kills the insmod task in the context of which ‘’do_oops’’ runs. Then it prints the following oops message:
root@qemux86:~/skels/debugging/oops# insmod oops.ko
BUG: unable to handle kernel NULL pointer dereference at 00000042
IP: do_oops+0x8/0x10 [oops]
*pde = 00000000
Oops: 0002 [#1] SMP
Modules linked in: oops(O+)
CPU: 0 PID: 234 Comm: insmod Tainted: G           O     4.15.0+ #3
Hardware name: QEMU Standard PC (i440FX + PIIX, 1996), BIOS Ubuntu-1.8.2-1ubuntu1 04/01/2014
EIP: do_oops+0x8/0x10 [oops]
EFLAGS: 00000292 CPU: 0
EAX: 00000061 EBX: 00000000 ECX: c7ed3584 EDX: c7ece8dc
ESI: c716c908 EDI: c8816010 EBP: c7257df0 ESP: c7257df0
DS: 007b ES: 007b FS: 00d8 GS: 0033 SS: 0068
CR0: 80050033 CR2: 00000042 CR3: 0785f000 CR4: 00000690
Call Trace:
so2_oops_init+0x17/0x20 [oops]
do_one_initcall+0x37/0x170
? cache_alloc_debugcheck_after.isra.19+0x15f/0x2f0
? __might_sleep+0x32/0x90
? trace_hardirqs_on_caller+0x11c/0x1a0
? do_init_module+0x17/0x1c2
? kmem_cache_alloc+0xa4/0x1e0
? do_init_module+0x17/0x1c2
do_init_module+0x46/0x1c2
load_module+0x1f45/0x2380
SyS_init_module+0xe5/0x100
do_int80_syscall_32+0x61/0x190
entry_INT80_32+0x2f/0x2f
EIP: 0x44902cc2
EFLAGS: 00000206 CPU: 0
EAX: ffffffda EBX: 08afb050 ECX: 0000eef4 EDX: 08afb008
ESI: 00000000 EDI: bf914dbc EBP: 00000000 ESP: bf914c1c
DS: 007b ES: 007b FS: 0000 GS: 0033 SS: 007b
Code: <a3> 42 00 00 00 5d c3 90 55 89 e5 83 ec 04 c7 04 24 24 70 81 c8 e8
EIP: do_oops+0x8/0x10 [oops] SS:ESP: 0068:c7257df0
CR2: 0000000000000042
---[ end trace 011848be72f8bb42 ]---
Killed
An oops contains information about the IP which caused the fault, register status, process, CPU on which the fault happend like below:
root@qemux86:~/skels/debugging/oops# insmod oops.ko
BUG: unable to handle kernel NULL pointer dereference at 00000042
IP: do_oops+0x8/0x10 [oops]
*pde = 00000000
Oops: 0002 [#1] SMP
Modules linked in: oops(O+)
CPU: 0 PID: 234 Comm: insmod Tainted: G           O     4.15.0+ #3
Hardware name: QEMU Standard PC (i440FX + PIIX, 1996), BIOS Ubuntu-1.8.2-1ubuntu1 04/01/2014
EIP: do_oops+0x8/0x10 [oops]
CR0: 80050033 CR2: 00000042 CR3: 0785f000 CR4: 00000690
EIP: 0x44902cc2
EFLAGS: 00000206 CPU: 0
EAX: ffffffda EBX: 08afb050 ECX: 0000eef4 EDX: 08afb008
ESI: 00000000 EDI: bf914dbc EBP: 00000000 ESP: bf914c1c
DS: 007b ES: 007b FS: 0000 GS: 0033 SS: 007b
Code: <a3> 42 00 00 00 5d c3 90 55 89 e5 83 ec 04 c7 04 24 24 70 81 c8 e8
Killed
Another important thing that an oops can provide is the stack trace of functions called before the fault happend:
root@qemux86:~/skels/debugging/oops# insmod oops.ko
BUG: unable to handle kernel NULL pointer dereference at 00000042
Call Trace:
so2_oops_init+0x17/0x20 [oops]
do_one_initcall+0x37/0x170
? cache_alloc_debugcheck_after.isra.19+0x15f/0x2f0
? __might_sleep+0x32/0x90
? trace_hardirqs_on_caller+0x11c/0x1a0
? do_init_module+0x17/0x1c2
? kmem_cache_alloc+0xa4/0x1e0
? do_init_module+0x17/0x1c2
do_init_module+0x46/0x1c2
load_module+0x1f45/0x2380
SyS_init_module+0xe5/0x100
do_int80_syscall_32+0x61/0x190
entry_INT80_32+0x2f/0x2f
Killed
Decoding an oops
- CONFIG_DEBUG_INFO
- addr2line
- gdb
- objdump -dSr
addr2line
addr2line translates addresses into file names and line numbers. Given an address in an executable it uses the debugging information to figure out which file name and line number are associated with it.
Modules are loaded at dynamic addresses but are compiled starting with 0 as a base address. So, in order to find the line number for a given dynamic address we need to know module’s load address.
$ addr2line -e oops.o  0x08
$ skels/debugging/oops/oops.c:5
$ # 0x08 is the offset of the offending instruction inside the oops.ko module
objdump
Similar we can determine the offending line using objdump:
$ cat /proc/modules
oops 20480 1 - Loading 0xc8816000 (O+)

$ objdump -dS --adjust-vma=0xc8816000 oops.ko
c8816000:       b8 61 00 00 00          mov    $0x61,%eax

static noinline void do_oops(void)
{
c8816005:       55                      push   %ebp
c8816006:       89 e5                   mov    %esp,%ebp
*(int*)0x42 = 'a';
c8816008:       a3 42 00 00 00          mov    %eax,0x42
gdb
$ gdb ./vmlinux

(gdb) list *(do_panic+0x8)
0xc1244138 is in do_panic (lib/test_panic.c:8).
3
4 static struct timer_list panic_timer;
5
6 static void do_panic(struct timer_list *unused)
7 {
8         *(int*)0x42 = 'a';
9 }
10
11        static int so2_panic_init(void)
Kernel panic
A kernel panic is a special type of oops where the kernel cannot continue execution. For example if the function do_oops from above was called in the interrupt context, the kernel wouldn’t know how to kill and it will decide that it is better to crash the kernel and stop execution.
Here is a sample code that will generate a kernel panic:
static struct timer_list panic_timer;

static void do_panic(struct timer_list *unused)
{
    *(int*)0x42 = 'a';
}

static int so2_panic_init(void)
{
    pr_info("panic_init\n");

    timer_setup(&panic_timer,  do_panic, 0);
    mod_timer(&panic_timer, jiffies + 2 * HZ);

    return 0;
}
Loading the module will generate the following kernel panic message:
root@qemux86:~/skels/debugging/panic# insmod panic.ko
panic: loading out-of-tree module taints kernel.
panic_init
root@qemux86:~/skels/debugging/panic# BUG: unable to handle kernel NULL pointer dereference at 00000042
IP: do_panic+0x8/0x10 [panic]
*pde = 00000000
Oops: 0002 [#1] SMP
Modules linked in: panic(O)
CPU: 0 PID: 0 Comm: swapper/0 Tainted: G           O     4.15.0+ #19
Hardware name: QEMU Standard PC (i440FX + PIIX, 1996), BIOS Ubuntu-1.8.2-1ubuntu1 04/01/2014
EIP: do_panic+0x8/0x10 [panic]
EFLAGS: 00010246 CPU: 0
EAX: 00000061 EBX: 00000101 ECX: 000002d8 EDX: 00000000
ESI: c8817000 EDI: c8819200 EBP: c780ff34 ESP: c780ff34
DS: 007b ES: 007b FS: 00d8 GS: 0000 SS: 0068
CR0: 80050033 CR2: 00000042 CR3: 0716b000 CR4: 00000690
Call Trace:
<SOFTIRQ>
call_timer_fn+0x63/0xf0
? process_timeout+0x10/0x10
run_timer_softirq+0x14f/0x170
? 0xc8817000
? trace_hardirqs_on_caller+0x9b/0x1a0
__do_softirq+0xde/0x1f2
? __irqentry_text_end+0x6/0x6
do_softirq_own_stack+0x57/0x70
</SOFTIRQ>
irq_exit+0x7d/0x90
smp_apic_timer_interrupt+0x4f/0x90
? trace_hardirqs_off_thunk+0xc/0x1d
apic_timer_interrupt+0x3a/0x40
EIP: default_idle+0xa/0x10
EFLAGS: 00000246 CPU: 0
EAX: c15c97c0 EBX: 00000000 ECX: 00000000 EDX: 00000001
ESI: 00000000 EDI: 00000000 EBP: c15c3f48 ESP: c15c3f48
DS: 007b ES: 007b FS: 00d8 GS: 0000 SS: 0068
arch_cpu_idle+0x9/0x10
default_idle_call+0x19/0x30
do_idle+0x105/0x180
cpu_startup_entry+0x25/0x30
rest_init+0x1e3/0x1f0
start_kernel+0x305/0x30a
i386_start_kernel+0x95/0x99
startup_32_smp+0x15f/0x164
Code: <a3> 42 00 00 00 5d c3 90 55 89 e5 83 ec 08 c7 04 24 24 80 81 c8 e8
EIP: do_panic+0x8/0x10 [panic] SS:ESP: 0068:c780ff34
CR2: 0000000000000042
---[ end trace 77f49f83f2e42f91 ]---
Kernel panic - not syncing: Fatal exception in interrupt
Kernel Offset: disabled
---[ end Kernel panic - not syncing: Fatal exception in interrupt
List debugging
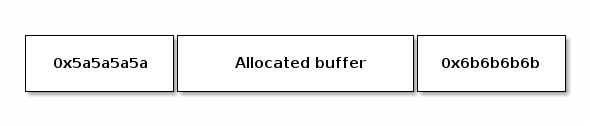
In order to catch access to uninitialized elements the kernel uses poison magic values.
static inline void list_del(struct list_head *entry)
{
        __list_del(entry->prev, entry->next);
        entry->next = (struct list_head*)LIST_POISON1;
        entry->prev = (struct list_head*)LIST_POISON2;
}

BUG: unable to handle kernel NULL pointer dereference at 00000100
IP: crush+0x80/0xb0 [list]
Memory debugging
There are several tools for memory debugging:
- DEBUG_SLAB
- KASAN
- kmemcheck
- DEBUG_PAGEALLOC
KASAN
KASan is a dynamic memory error detector designed to find use-after-free and out-of-bounds bugs.
The main idea of KASAN is to use shadow memory to record whether each byte of memory is safe to access or not, and use compiler’s instrumentation to check the shadow memory on each memory access.
Address sanitizer uses 1 byte of shadow memory to track 8 bytes of kernel address space. It uses 0-7 to encode the number of consecutive bytes at the beginning of the eigh-byte region that are valid.
See Documentation/dev-tools/kasan.rst for more information and have a look at lib/test_kasan.c for an example of problems that KASan can detect.
- dynamic memory error detector
- finds user-after-free or out-of-bound bugs
- uses shadow memory to track memory operations
- lib/test_kasan.c
Comparison between memory debugging tools
kmemcheck
KASan can do almost everything that kmemcheck can. KASan uses compile-time instrumentation, which makes it significantly faster than kmemcheck. The only advantage of kmemcheck over KASan is detection of unitialized memory reads.
DEBUG_PAGEALLOC
KASan is slower than DEBUG_PAGEALLOC, but KASan works on sub-page granularity level, so it able to find more bugs.
SLUB_DEBUG
- SLUB_DEBUG has lower overhead than KASan.
- SLUB_DEBUG in most cases are not able to detect bad reads, KASan able to detect both reads and writes.
- In some cases (e.g. redzone overwritten) SLUB_DEBUG detect bugs only on allocation/freeing of object. KASan catch bugs right before it will happen, so we always know exact place of first bad read/write.
Kmemleak
Kmemleak provides a way of detecting kernel memory leaks in a way similar to a tracing garbage collector. You can find more information here in Documentation/dev-tools/kmemleak.rst.
- CONFIG_DEBUG_KMEMLEAK
- mount -t debugfs nodev /sys/kernel/debug
- echo scan > /sys/kernel/debug/kmemleak
- echo clear > /sys/kernel/debug/kmemleak
- cat /sys/kernel/debug/kmemleak
Lets have a look at tools/labs/debugging/leak/leak.c file.
Lockdep checker
- CONFIG_DEBUG_LOCKDEP
- lock inversion
- cyclic dependency
- incorrect usage of locks
Other tools
- ftrace
- kprobes
- sparse
- coccinelle
- checkpatch.pl
- printk
- dump_stack()