SO2 Lecture 09 - Kernel debugging
Lecture objectives:
One essential part of Linux kernel development is debugging. In user space we had the support of the kernel so we could easily stop processes and use gdb to inspect their behavior. In the kernel, in order to use gdb we need to use hypervisor like QEMU or JTAG based hardware interfaces which are not always available. The Linux kernel provides a set of tools and debug options useful for investigating abnormal behavior.
In this lecture we will learn about:
- decoding an oops/panic
- list debugging
- memory debugging
- locking debugging
- profiling
Decoding an oops/panic
An oops is an inconsistent state that the kernel detects inside itself. Upon detecting an oops the Linux kernel kills the offending process, prints information that can help debug the problem and continues execution but with limited reliability.
Lets consider the following Linux kernel module:
static noinline void do_oops(void)
{
    *(int*)0x42 = 'a';
}

static int so2_oops_init(void)
{
    pr_info("oops_init\n");
    do_oops();

    return 0;
}

static void so2_oops_exit(void)
{
    pr_info("oops exit\n");
}

module_init(so2_oops_init);
module_exit(so2_oops_exit);
Notice that ''do_oops'' function tries to write at an invalid memory address. Because the kernel cannot find a suitable physical page were to write, it kills the insmod task in the context of which ''do_oops'' runs. Then it prints the following oops message:
root@qemux86:~/skels/debugging/oops# insmod oops.ko
BUG: unable to handle kernel NULL pointer dereference at 00000042
IP: do_oops+0x8/0x10 [oops]
*pde = 00000000
Oops: 0002 [#1] SMP
Modules linked in: oops(O+)
CPU: 0 PID: 234 Comm: insmod Tainted: G           O     4.15.0+ #3
Hardware name: QEMU Standard PC (i440FX + PIIX, 1996), BIOS Ubuntu-1.8.2-1ubuntu1 04/01/2014
EIP: do_oops+0x8/0x10 [oops]
EFLAGS: 00000292 CPU: 0
EAX: 00000061 EBX: 00000000 ECX: c7ed3584 EDX: c7ece8dc
ESI: c716c908 EDI: c8816010 EBP: c7257df0 ESP: c7257df0
DS: 007b ES: 007b FS: 00d8 GS: 0033 SS: 0068
CR0: 80050033 CR2: 00000042 CR3: 0785f000 CR4: 00000690
Call Trace:
so2_oops_init+0x17/0x20 [oops]
do_one_initcall+0x37/0x170
? cache_alloc_debugcheck_after.isra.19+0x15f/0x2f0
? __might_sleep+0x32/0x90
? trace_hardirqs_on_caller+0x11c/0x1a0
? do_init_module+0x17/0x1c2
? kmem_cache_alloc+0xa4/0x1e0
? do_init_module+0x17/0x1c2
do_init_module+0x46/0x1c2
load_module+0x1f45/0x2380
SyS_init_module+0xe5/0x100
do_int80_syscall_32+0x61/0x190
entry_INT80_32+0x2f/0x2f
EIP: 0x44902cc2
EFLAGS: 00000206 CPU: 0
EAX: ffffffda EBX: 08afb050 ECX: 0000eef4 EDX: 08afb008
ESI: 00000000 EDI: bf914dbc EBP: 00000000 ESP: bf914c1c
DS: 007b ES: 007b FS: 0000 GS: 0033 SS: 007b
Code: <a3> 42 00 00 00 5d c3 90 55 89 e5 83 ec 04 c7 04 24 24 70 81 c8 e8
EIP: do_oops+0x8/0x10 [oops] SS:ESP: 0068:c7257df0
CR2: 0000000000000042
---[ end trace 011848be72f8bb42 ]---
Killed
An oops contains information about the IP which caused the fault, register status, process, CPU on which the fault happend like below:
root@qemux86:~/skels/debugging/oops# insmod oops.ko
BUG: unable to handle kernel NULL pointer dereference at 00000042
IP: do_oops+0x8/0x10 [oops]
*pde = 00000000
Oops: 0002 [#1] SMP
Modules linked in: oops(O+)
CPU: 0 PID: 234 Comm: insmod Tainted: G           O     4.15.0+ #3
Hardware name: QEMU Standard PC (i440FX + PIIX, 1996), BIOS Ubuntu-1.8.2-1ubuntu1 04/01/2014
EIP: do_oops+0x8/0x10 [oops]
CR0: 80050033 CR2: 00000042 CR3: 0785f000 CR4: 00000690
EIP: 0x44902cc2
EFLAGS: 00000206 CPU: 0
EAX: ffffffda EBX: 08afb050 ECX: 0000eef4 EDX: 08afb008
ESI: 00000000 EDI: bf914dbc EBP: 00000000 ESP: bf914c1c
DS: 007b ES: 007b FS: 0000 GS: 0033 SS: 007b
Code: <a3> 42 00 00 00 5d c3 90 55 89 e5 83 ec 04 c7 04 24 24 70 81 c8 e8
Killed
Another important thing that an oops can provide is the stack trace of functions called before the fault happend:
root@qemux86:~/skels/debugging/oops# insmod oops.ko
BUG: unable to handle kernel NULL pointer dereference at 00000042
Call Trace:
so2_oops_init+0x17/0x20 [oops]
do_one_initcall+0x37/0x170
? cache_alloc_debugcheck_after.isra.19+0x15f/0x2f0
? __might_sleep+0x32/0x90
? trace_hardirqs_on_caller+0x11c/0x1a0
? do_init_module+0x17/0x1c2
? kmem_cache_alloc+0xa4/0x1e0
? do_init_module+0x17/0x1c2
do_init_module+0x46/0x1c2
load_module+0x1f45/0x2380
SyS_init_module+0xe5/0x100
do_int80_syscall_32+0x61/0x190
entry_INT80_32+0x2f/0x2f
Killed
Decoding an oops
- CONFIG_DEBUG_INFO
- addr2line
- gdb
- objdump -dSr
addr2line
addr2line translates addresses into file names and line numbers. Given an address in an executable it uses the debugging information to figure out which file name and line number are associated with it.
Modules are loaded at dynamic addresses but are compiled starting with 0 as a base address. So, in order to find the line number for a given dynamic address we need to know module's load address.
$ addr2line -e oops.o  0x08
$ skels/debugging/oops/oops.c:5
$ # 0x08 is the offset of the offending instruction inside the oops.ko module
objdump
Similar we can determine the offending line using objdump:
$ cat /proc/modules
oops 20480 1 - Loading 0xc8816000 (O+)

$ objdump -dS --adjust-vma=0xc8816000 oops.ko
c8816000:       b8 61 00 00 00          mov    $0x61,%eax

static noinline void do_oops(void)
{
c8816005:       55                      push   %ebp
c8816006:       89 e5                   mov    %esp,%ebp
*(int*)0x42 = 'a';
c8816008:       a3 42 00 00 00          mov    %eax,0x42
gdb
$ gdb ./vmlinux

(gdb) list *(do_panic+0x8)
0xc1244138 is in do_panic (lib/test_panic.c:8).
3
4 static struct timer_list panic_timer;
5
6 static void do_panic(struct timer_list *unused)
7 {
8         *(int*)0x42 = 'a';
9 }
10
11        static int so2_panic_init(void)
Kernel panic
A kernel panic is a special type of oops where the kernel cannot continue execution. For example if the function do_oops from above was called in the interrupt context, the kernel wouldn't know how to kill and it will decide that it is better to crash the kernel and stop execution.
Here is a sample code that will generate a kernel panic:
static struct timer_list panic_timer;

static void do_panic(struct timer_list *unused)
{
    *(int*)0x42 = 'a';
}

static int so2_panic_init(void)
{
    pr_info("panic_init\n");

    timer_setup(&panic_timer,  do_panic, 0);
    mod_timer(&panic_timer, jiffies + 2 * HZ);

    return 0;
}
Loading the module will generate the following kernel panic message:
root@qemux86:~/skels/debugging/panic# insmod panic.ko
panic: loading out-of-tree module taints kernel.
panic_init
root@qemux86:~/skels/debugging/panic# BUG: unable to handle kernel NULL pointer dereference at 00000042
IP: do_panic+0x8/0x10 [panic]
*pde = 00000000
Oops: 0002 [#1] SMP
Modules linked in: panic(O)
CPU: 0 PID: 0 Comm: swapper/0 Tainted: G           O     4.15.0+ #19
Hardware name: QEMU Standard PC (i440FX + PIIX, 1996), BIOS Ubuntu-1.8.2-1ubuntu1 04/01/2014
EIP: do_panic+0x8/0x10 [panic]
EFLAGS: 00010246 CPU: 0
EAX: 00000061 EBX: 00000101 ECX: 000002d8 EDX: 00000000
ESI: c8817000 EDI: c8819200 EBP: c780ff34 ESP: c780ff34
DS: 007b ES: 007b FS: 00d8 GS: 0000 SS: 0068
CR0: 80050033 CR2: 00000042 CR3: 0716b000 CR4: 00000690
Call Trace:
<SOFTIRQ>
call_timer_fn+0x63/0xf0
? process_timeout+0x10/0x10
run_timer_softirq+0x14f/0x170
? 0xc8817000
? trace_hardirqs_on_caller+0x9b/0x1a0
__do_softirq+0xde/0x1f2
? __irqentry_text_end+0x6/0x6
do_softirq_own_stack+0x57/0x70
</SOFTIRQ>
irq_exit+0x7d/0x90
smp_apic_timer_interrupt+0x4f/0x90
? trace_hardirqs_off_thunk+0xc/0x1d
apic_timer_interrupt+0x3a/0x40
EIP: default_idle+0xa/0x10
EFLAGS: 00000246 CPU: 0
EAX: c15c97c0 EBX: 00000000 ECX: 00000000 EDX: 00000001
ESI: 00000000 EDI: 00000000 EBP: c15c3f48 ESP: c15c3f48
DS: 007b ES: 007b FS: 00d8 GS: 0000 SS: 0068
arch_cpu_idle+0x9/0x10
default_idle_call+0x19/0x30
do_idle+0x105/0x180
cpu_startup_entry+0x25/0x30
rest_init+0x1e3/0x1f0
start_kernel+0x305/0x30a
i386_start_kernel+0x95/0x99
startup_32_smp+0x15f/0x164
Code: <a3> 42 00 00 00 5d c3 90 55 89 e5 83 ec 08 c7 04 24 24 80 81 c8 e8
EIP: do_panic+0x8/0x10 [panic] SS:ESP: 0068:c780ff34
CR2: 0000000000000042
---[ end trace 77f49f83f2e42f91 ]---
Kernel panic - not syncing: Fatal exception in interrupt
Kernel Offset: disabled
---[ end Kernel panic - not syncing: Fatal exception in interrupt
List debugging
In order to catch access to uninitialized elements the kernel uses poison magic values.
static inline void list_del(struct list_head *entry)
{
        __list_del(entry->prev, entry->next);
        entry->next = (struct list_head*)LIST_POISON1;
        entry->prev = (struct list_head*)LIST_POISON2;
}

BUG: unable to handle kernel NULL pointer dereference at 00000100
IP: crush+0x80/0xb0 [list]
Memory debugging
There are several tools for memory debugging:
- SLAB/SLUB debugging
- KASAN
- kmemcheck
- DEBUG_PAGEALLOC
Slab debugging
Slab debugging uses a memory poison technique to detect several types of memory bugs in the SLAB/SUB allocators.
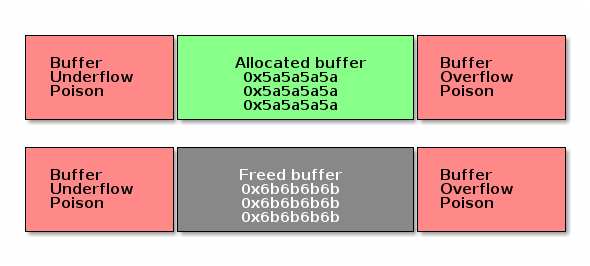
The allocated buffers are guarded with memory that has been filled in with special markers. Any adjacent writes to the buffer will be detected at a later time when other memory management operations on that buffer are performed (e.g. when the buffer is freed).
Upon allocation of the buffer, the buffer it is also filled in with a special value to potentially detect buffer access before initialization (e.g. if the buffer holds pointers). The value is selected in such a way that it is unlikely to be a valid address and as such to trigger kernel bugs at the access time.
A similar technique is used when freeing the buffer: the buffer is filled with another special value that will cause kernel bugs if pointers are accessed after the memory is freed. In this case, the allocator also checks the next time the buffer is allocated that the buffer was not modified.
The diagram bellow shows a summary of the way SLAB/SLUB poisoning works:
- CONFIG_DEBUG_SLAB
- poisoned based memory debuggers
Example of an use before initialize bug:
BUG: unable to handle kernel paging request at 5a5a5a5a
IP: [<c1225063>] __list_del_entry+0x37/0x71
…
Call Trace:
[<c12250a8>] list_del+0xb/0x1b
[<f1de81a2>] use_before_init+0x31/0x38 [crusher]
[<f1de8265>] crush_it+0x38/0xa9 [crusher]
[<f1de82de>] init_module+0x8/0xa [crusher]
[<c1001072>] do_one_initcall+0x72/0x119
[<f1de82d6>] ? crush_it+0xa9/0xa9 [crusher]
[<c106b8ae>] sys_init_module+0xc8d/0xe77
[<c14d7d18>] syscall_call+0x7/0xb
noinline void use_before_init(void)
{
     struct list_m *m = kmalloc(sizeof(*m), GFP_KERNEL);

     printk("%s\n", __func__);
     list_del(&m->lh);
}
Example of an use after free bug:
BUG: unable to handle kernel paging request at 6b6b6b6b
IP: [<c1225063>] __list_del_entry+0x37/0x71
…
Call Trace:
[<c12250a8>] list_del+0xb/0x1b
[<f4c6816a>] use_after_free+0x38/0x3f [crusher]
[<f4c6827f>] crush_it+0x52/0xa9 [crusher]
[<f4c682de>] init_module+0x8/0xa [crusher]
[<c1001072>] do_one_initcall+0x72/0x119
[<f4c682d6>] ? crush_it+0xa9/0xa9 [crusher]
[<c106b8ae>] sys_init_module+0xc8d/0xe77
[<c14d7d18>] syscall_call+0x7/0xb
noinline void use_after_free(void)
{
    struct list_m *m = kmalloc(sizeof(*m), GFP_KERNEL);

    printk("%s\n", __func__);
    kfree(m);
    list_del(&m->lh);
}
Another example of an use after free bug is shown below. Note that this time the bug is detected at the next allocation.
# insmod /system/lib/modules/crusher.ko test=use_before_init
Slab corruption: size-4096 start=ed612000, len=4096
000: 00 00 00 00 00 00 00 00 00 00 00 00 00 00 00 00
010: 00 00 00 00 00 00 00 00 00 00 00 00 00 00 6b 6b
noinline void use_after_free2(void)
{
    char *b = kmalloc(3000, GFP_KERNEL);
    kfree(b);
    memset(b, 0, 30);
    b = kmalloc(3000, GFP_KERNEL);
    kfree(b);
}
Finally this is an example of a buffer overflow bug:
slab error in verify_redzone_free(): cache `dummy': memory outside object was overwritten
Pid: 1282, comm: insmod Not tainted 3.0.16-mid10-00007-ga4a6b62-dirty #70
Call Trace:
[<c10cc1de>] __slab_error+0x17/0x1c
[<c10cc7ca>] __cache_free+0x12c/0x317
[<c10ccaba>] kmem_cache_free+0x2b/0xaf
[<f27f1138>] buffer_overflow+0x4c/0x57 [crusher]
[<f27f12aa>] crush_it+0x6c/0xa9 [crusher]
[<f27f12ef>] init_module+0x8/0xd [crusher]
[<c1001072>] do_one_initcall+0x72/0x119
[<c106b8ae>] sys_init_module+0xc8d/0xe77
[<c14d7d18>] syscall_call+0x7/0xb
eb002bf8: redzone 1:0xd84156c5635688c0, redzone 2:0x0
noinline void buffer_overflow(void)
{
    struct kmem_cache *km = kmem_cache_create("dummy", 3000, 0, 0, NULL);
    char *b = kmem_cache_alloc(km, GFP_KERNEL);

    printk("%s\n", __func__);
    memset(b, 0, 3016);
    kmem_cache_free(km, b);
}
DEBUG_PAGEALLOC
- Memory debugger that works at a page level
- Detects invalid accesses either by:
- Filling pages with poison byte patterns and checking the pattern at reallocation
- Unmapping the dellocated pages from kernel space (just a few architectures)
KASan
KASan is a dynamic memory error detector designed to find use-after-free and out-of-bounds bugs.
The main idea of KASAN is to use shadow memory to record whether each byte of memory is safe to access or not, and use compiler's instrumentation to check the shadow memory on each memory access.
Address sanitizer uses 1 byte of shadow memory to track 8 bytes of kernel address space. It uses 0-7 to encode the number of consecutive bytes at the beginning of the eigh-byte region that are valid.
See The Kernel Address Sanitizer (KASAN) for more information and have a look at lib/test_kasan.c for an example of problems that KASan can detect.
- dynamic memory error detector
- finds user-after-free or out-of-bound bugs
- uses shadow memory to track memory operations
- lib/test_kasan.c
KASan vs DEBUG_PAGEALLOC
KASan is slower than DEBUG_PAGEALLOC, but KASan works on sub-page granularity level, so it able to find more bugs.
KASan vs SLUB_DEBUG
- SLUB_DEBUG has lower overhead than KASan.
- SLUB_DEBUG in most cases are not able to detect bad reads, KASan able to detect both reads and writes.
- In some cases (e.g. redzone overwritten) SLUB_DEBUG detect bugs only on allocation/freeing of object. KASan catch bugs right before it will happen, so we always know exact place of first bad read/write.
Kmemleak
Kmemleak provides a way of detecting kernel memory leaks in a way similar to a tracing garbage collector. Since tracing pointers is not possible in C, kmemleak scans the kernel stacks as well as dynamically and statically kernel memory for pointers to allocated buffers. A buffer for which there is no pointer is considered as leaked. The basic steps to use kmemleak are presented bellow, for more information see Kernel Memory Leak Detector
- enable kernel config: CONFIG_DEBUG_KMEMLEAK
- setup: mount -t debugfs nodev /sys/kernel/debug
- trigger a memory scan: echo scan > /sys/kernel/debug/kmemleak
- show memory leaks: cat /sys/kernel/debug/kmemleak
- clear all possible leaks: echo clear > /sys/kernel/debug/kmemleak
As an example, lets look at the following simple module:
static int leak_init(void)
{
    pr_info("%s\n", __func__);

    (void)kmalloc(16, GFP_KERNEL);

    return 0;
}

MODULE_LICENSE("GPL v2");
module_init(leak_init);
Loading the module and triggering a kmemleak scan will issue the following report:
root@qemux86:~# insmod skels/debugging/leak/leak.ko
leak: loading out-of-tree module taints kernel.
leak_init
root@qemux86:~# echo scan > /sys/kernel/debug/kmemleak
root@qemux86:~# echo scan > /sys/kernel/debug/kmemleak
kmemleak: 1 new suspected memory leaks (see /sys/kernel/debug/kmemleak)
root@qemux86:~# cat /sys/kernel/debug/kmemleak
unreferenced object 0xd7871500 (size 32):
comm "insmod", pid 237, jiffies 4294902108 (age 24.628s)
hex dump (first 32 bytes):
5a 5a 5a 5a 5a 5a 5a 5a 5a 5a 5a 5a 5a 5a 5a 5a  ZZZZZZZZZZZZZZZZ
5a 5a 5a 5a 5a 5a 5a 5a 5a 5a 5a 5a 5a 5a 5a a5  ZZZZZZZZZZZZZZZ.
backtrace:
[<(ptrval)>] kmem_cache_alloc_trace+0x163/0x310
[<(ptrval)>] leak_init+0x2f/0x1000 [leak]
[<(ptrval)>] do_one_initcall+0x57/0x2e0
[<(ptrval)>] do_init_module+0x4b/0x1be
[<(ptrval)>] load_module+0x201a/0x2590
[<(ptrval)>] sys_init_module+0xfd/0x120
[<(ptrval)>] do_int80_syscall_32+0x6a/0x1a0
Note
Notice that we did not had to unload the module to detect the memory leak since kmemleak detects that the allocated buffer is not reachable anymore.
Lockdep checker
- CONFIG_DEBUG_LOCKDEP
- Detects lock inversio, circular dependencies, incorrect usage of locks (including interrupt context)
- Maintains dependency between classes of locks not individual locks
- Each scenario is only checked once and hashed
Lets take for example the following kernel module that runs two kernel threads:
static noinline int thread_a(void *unused)
{
  mutex_lock(&a); pr_info("%s acquired A\n", __func__);
  mutex_lock(&b); pr_info("%s acquired B\n", __func__);

  mutex_unlock(&b);
  mutex_unlock(&a);

  return 0;
}
static noinline int thread_b(void *unused)
{
  mutex_lock(&b); pr_info("%s acquired B\n", __func__);
  mutex_lock(&a); pr_info("%s acquired A\n", __func__);

  mutex_unlock(&a);
  mutex_unlock(&b);

  return 0;
}
Loading this module with lockdep checker active will produce the following kernel log:
thread_a acquired A
thread_a acquired B
thread_b acquired B

======================================================
WARNING: possible circular locking dependency detected
4.19.0+ #4 Tainted: G           O
------------------------------------------------------
thread_b/238 is trying to acquire lock:
(ptrval) (a){+.+.}, at: thread_b+0x48/0x90 [locking]

but task is already holding lock:
(ptrval) (b){+.+.}, at: thread_b+0x27/0x90 [locking]

which lock already depends on the new lock.
As you can see, although the deadlock condition did not trigger (because thread A did not complete execution before thread B started execution) the lockdep checker identified a potential deadlock scenario.
Lockdep checker will provide even more information to help determine what caused the deadlock, like the dependency chain:
the existing dependency chain (in reverse order) is:

-> #1 (b){+.+.}:
      __mutex_lock+0x60/0x830
      mutex_lock_nested+0x20/0x30
      thread_a+0x48/0x90 [locking]
      kthread+0xeb/0x100
      ret_from_fork+0x2e/0x38

-> #0 (a){+.+.}:
      lock_acquire+0x93/0x190
      __mutex_lock+0x60/0x830
      mutex_lock_nested+0x20/0x30
      thread_b+0x48/0x90 [locking]
      kthread+0xeb/0x100
      ret_from_fork+0x2e/0x38
and even an unsafe locking scenario:
other info that might help us debug this:

Possible unsafe locking scenario:

CPU0                    CPU1
----                    ----
lock(b);
                        lock(a);
                        lock(b);
lock(a);

*** DEADLOCK ***
Another example of unsafe locking issues that lockdep checker detects is unsafe locking from interrupt context. Lets consider the following kernel module:
static DEFINE_SPINLOCK(lock);

static void timerfn(struct timer_list *unused)
{
  pr_info("%s acquiring lock\n", __func__);
  spin_lock(&lock);   pr_info("%s acquired lock\n", __func__);
  spin_unlock(&lock); pr_info("%s released lock\n", __func__);
}

static DEFINE_TIMER(timer, timerfn);

int init_module(void)
{
  mod_timer(&timer, jiffies);

  pr_info("%s acquiring lock\n", __func__);
  spin_lock(&lock);   pr_info("%s acquired lock\n", __func__);
  spin_unlock(&lock); pr_info("%s released lock\n", __func__);
  return 0;
}
As in the previous case, loading the module will trigger a lockdep warning:
init_module acquiring lock
init_module acquired lock
init_module released lock
timerfn acquiring lock

================================
WARNING: inconsistent lock state
4.19.0+ #4 Tainted: G           O
--------------------------------
inconsistent {SOFTIRQ-ON-W} -> {IN-SOFTIRQ-W} usage.
ksoftirqd/0/9 [HC0[0]:SC1[1]:HE1:SE0] takes:
(ptrval) (lock#4){+.?.}, at: timerfn+0x25/0x60 [locking2]
{SOFTIRQ-ON-W} state was registered at:
lock_acquire+0x93/0x190
_raw_spin_lock+0x39/0x50
init_module+0x35/0x70 [locking2]
do_one_initcall+0x57/0x2e0
do_init_module+0x4b/0x1be
load_module+0x201a/0x2590
sys_init_module+0xfd/0x120
do_int80_syscall_32+0x6a/0x1a0
restore_all+0x0/0x8d
The warning will also provide additional information and a potential unsafe locking scenario:
Possible unsafe locking scenario:

       CPU0
       ----
       lock(lock#4);
       <Interrupt>
       lock(lock#4);

       *** DEADLOCK ***

1 lock held by ksoftirqd/0/9:
#0: (ptrval) (/home/tavi/src/linux/tools/labs/skels/./debugging/locking2/locking2.c:13){+.-.}, at: call_timer_f0
stack backtrace:
CPU: 0 PID: 9 Comm: ksoftirqd/0 Tainted: G           O      4.19.0+ #4
Hardware name: QEMU Standard PC (i440FX + PIIX, 1996), BIOS 1.10.2-1ubuntu1 04/01/2014
Call Trace:
dump_stack+0x66/0x96
print_usage_bug.part.26+0x1ee/0x200
mark_lock+0x5ea/0x640
__lock_acquire+0x4b4/0x17a0
lock_acquire+0x93/0x190
_raw_spin_lock+0x39/0x50
timerfn+0x25/0x60 [locking2]
perf
- performance counters, tracepoints, kprobes, uprobes
- hardware events: CPU cycles, TLB misses, cache misses
- software events: page faults , context switches
- collects backtraces (user + kernel)
Other tools
- ftrace
- kprobes
- sparse
- coccinelle
- checkpatch.pl
- printk
- dump_stack()